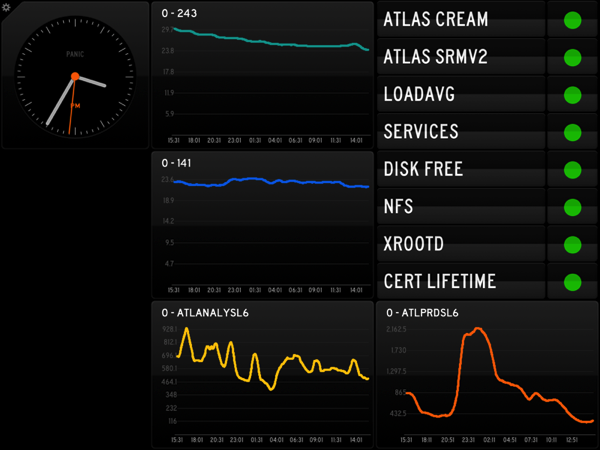
Last year about this time, Panic released Status Board for the iPad. At the time I was really impressed with it, but we weren’t really set up to make use of it. In the interim, we’ve refreshed our monitoring and in particular are now using Graphite. Over the past couple of days I’ve been working with a couple of types of status update:
- Naemon/nagios statuses
- Graphite graphing
For the Naemon status updates, I’m using a python script using livestatus to grab the status of key probes. Some of these are site level statuses (in the screen below ATLAS CREAM and ATLAS SRMv2 are taken from the LCG SAM probe discussed a few weeks ago) and some are taken from looking at the cluster as a whole. In those cases (see for example LOADAVG) this alerts if at least one probe goes critical - I can then go and investigate further. At the moment, I’ve also set it so that if an alarm is acknowledged, this board switches back to OK for that probe - for the moment I’m more concerned with things I have to worry about that something that I understand, even though it might not be fully resolved.
The graphs take the raw json data from graphite and, for the moment, do the simple thing of using the CSV formatting that Status Board uses by default. The next step is to tidy this up by using the custom formatting available - but even as it stands I think it works pretty well.
There’s space left at one side for a to do list or something else - a project list, for example - once I work out the most useful way to work with that.

No comments:
Post a Comment