Icinga has announced a feature-freeze on the Icinga 2 Beta, with a release date for it scheduled for next Tuesday: see more details here for information on how to try it out.
Wednesday 21 May 2014
Wednesday 14 May 2014
Status Board and Glasgow
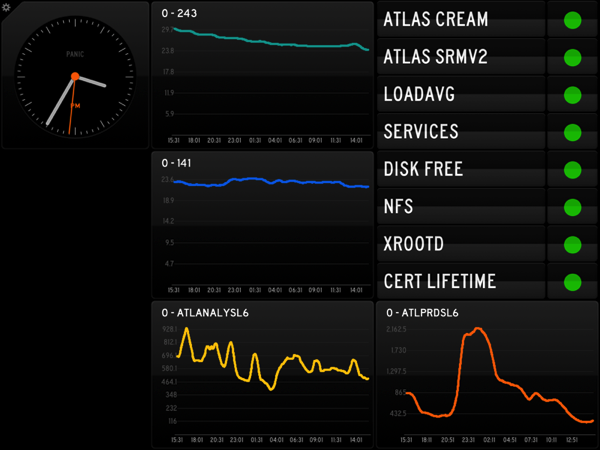
Last year about this time, Panic released Status Board for the iPad. At the time I was really impressed with it, but we weren’t really set up to make use of it. In the interim, we’ve refreshed our monitoring and in particular are now using Graphite. Over the past couple of days I’ve been working with a couple of types of status update:
- Naemon/nagios statuses
- Graphite graphing
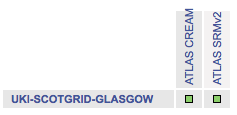
For the Naemon status updates, I’m using a python script using livestatus to grab the status of key probes. Some of these are site level statuses (in the screen below ATLAS CREAM and ATLAS SRMv2 are taken from the LCG SAM probe discussed a few weeks ago) and some are taken from looking at the cluster as a whole. In those cases (see for example LOADAVG) this alerts if at least one probe goes critical - I can then go and investigate further. At the moment, I’ve also set it so that if an alarm is acknowledged, this board switches back to OK for that probe - for the moment I’m more concerned with things I have to worry about that something that I understand, even though it might not be fully resolved.
The graphs take the raw json data from graphite and, for the moment, do the simple thing of using the CSV formatting that Status Board uses by default. The next step is to tidy this up by using the custom formatting available - but even as it stands I think it works pretty well.
There’s space left at one side for a to do list or something else - a project list, for example - once I work out the most useful way to work with that.
New version of Grafana
After Monitorama, a new version of Grafana is now available, version 1.5.4. Check here for details and to download.
Monitorama videos
I meant to watch the live stream from Monitorama a couple of weeks ago, but the time difference made that a bit more difficult. Fortunately, however, the individual videos are now becoming available. Check out the Monitorama vimeo channel for more details: look for the "Monitorama PDX 2014” tag.
Wednesday 7 May 2014
Icinga turns 5
Friday 25 April 2014
Monitorama
In a few days time the next Monitorama monitoring conference will take place in Portland - it’s running from May 5th-7th. It looks like there’s going to be a great set of talks and workshops - they’re planning to have these streamed at the time and available afterwards.
Monitoring Plugins
Having a quick check on the status of the monitoring-plugins and nagios-plugins packages, it looks like developments are continuing on both - monitoring-plugins is currently in review to be added to EPEL.
Thursday 17 April 2014
LCGSAM Nagios Plugin
The guys at PIC have been working on a new Nagios Plugin to read the LCG SAM data for your grid site. The Nagios Plugin LCG SAM uses a JSON feed to get up to date status information for your site, setting your vo (-v), profile (-p) and site (-s) , as well as optionally the test flavour (-f). It uses jq, a JSON processor for bash, which looks very interesting in its own right.
At Glasgow we’ve been using this test for the last few weeks splitting out ATLAS probes, with a CREAM-CE flavour and SRMv2 flavour. It has been reliable and useful in showing our status in our nagios/naemon dashboard.
All OK
New features in Graphite 0.10.0
Graphite has a new version under development, 0.10.0 - we’re currently running 0.9.12 from the EPEL repo. The full change list for the new version can be found here but I wanted to note a couple of the features:
- Metrics can be reordered via the composer.
- manage.py is no longer available. The alternative is to use the django-admin.py command provided by Django.
Git and Naemon
Developing our monitoring boxes, I wanted to make sure that a new server was configured as cleanly as possible (we're using puppet for new server configuration). I was looking for a way to efficiently keep nagios/naemon configs up to date across different machines, and it occurred to me that using a remote git repository was an ideal solution for this. Creating a new blank repository and copying in our current configuration, I could push and pull configs between machines easily - which is entirely the point of using git here, but it's nice to see it work. I'm now working to incorporate this into the build step so that a new machine pulls its config automatically.
We're now looking at further uses of git across the cluster (we have a number of fans at the site!)


