Friday 25 April 2014

Monitorama

In a few days time the next Monitorama monitoring conference will take place in Portland - it’s running from May 5th-7th. It looks like there’s going to be a great set of talks and workshops - they’re planning to have these streamed at the time and available afterwards. 

Monitoring Plugins

Having a quick check on the status of the monitoring-plugins and nagios-plugins packages, it looks like developments are continuing on both - monitoring-plugins is currently in review to be added to EPEL.

Thursday 17 April 2014

LCGSAM Nagios Plugin

The guys at PIC have been working on a new Nagios Plugin to read the LCG SAM data for your grid site. The Nagios Plugin LCG SAM uses a JSON feed to get up to date status information for your site, setting your vo (-v), profile (-p) and site (-s) , as well as optionally the test flavour (-f). It uses jq, a JSON processor for bash, which looks very interesting in its own right.

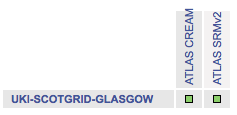
At Glasgow we’ve been using this test for the last few weeks splitting out ATLAS probes, with a CREAM-CE flavour and SRMv2 flavour. It has been reliable and useful in showing our status in our nagios/naemon dashboard.


Allokusg

All OK

New features in Graphite 0.10.0

Graphite has a new version under development, 0.10.0 - we’re currently running 0.9.12 from the EPEL repo. The full change list for the new version can be found here but I wanted to note a couple of the features:

  • Metrics can be reordered via the composer.
  • manage.py is no longer available. The alternative is to use the django-admin.py command provided by Django.
No word on the release date for this update has been given yet, but we’ll be testing it when it comes out.

Git and Naemon

We've started using git a lot more at Glasgow, and I've been working on using it to manage our new documentation. We've set up a number of remote git repositories to enable this. This has been working well for website development recently, and so I turned to the possibilities of using it elsewhere.

Developing our monitoring boxes, I wanted to make sure that a new server was configured as cleanly as possible (we're using puppet for new server configuration). I was looking for a way to efficiently keep nagios/naemon configs up to date across different machines, and it occurred to me that using a remote git repository was an ideal solution for this. Creating a new blank repository and copying in our current configuration, I could push and pull configs between machines easily - which is  entirely the point of using git here, but it's nice to see it work. I'm now working to incorporate this into the build step so that a new machine pulls its config automatically.

We're now looking at further uses of git across the cluster (we have a number of fans at the site!)
Naemon

As I mentioned in the last post, we've started using Naemon at Glasgow. Naemon is a fork of Nagios 4.0, largely lead by Andreas Ericsson who worked on Nagios 4.0 - for more information on the origins of the package, see the project page for Naemon here. It comes packaged with Thruk as it's frontend. While a young project (the first stable release, 0.8.0, was in February) it has already been working well for us and looks like it has a promising future.

Naemon and Thruk

At the last GridPP meeting in Pitlochry, I gave a talk [Indico link] where I mentioned the new Nagios 4.0 fork Naemon (more on that later). One of the screenshots I showed was of the great web frontend which comes with Naemon, called Thruk. I wanted to highlight a particular feature included in Thruk called Mine Map (screenshot below) which maps out every service and host in a grid showing the probe status in each case - everything here looks nice and green, which is pleasing.

The nice thing about this, of course, is that you can quickly pick out any problem areas quickly (We're using the Exfoliation theme, by the way). However, this gets even better when you use the Display filters at the top of the screen. One of the problems with seeing issues when most of the tests are green is picking out small patches of criticals, particularly if you have to scroll through a large estate to look for issues. 

Using the Display filters, however, you can choose to only show particular Services States - Critical, Warning, Pending or Unknown for example - and only show issues which have not been acknowledged. If I apply those settings now the display changes to something like the following:

Now we can see that we have two unacknowledged issues - a CVMFS problem on node296 and a problem with the services on svr008 (one of them is about to be rebuilt and one of them has just been rebuilt and so I'm keeping an eye on it).

So now I have a view of my Naemon/Nagios tests, with everything laid out in front of me and only the most urgent issues highlighted. You can also add extra filters, including grepping for particular hostnames, services or groups.